The chi-square distribution is an essential concept in statistics, also widely used in economic research. It represents the distribution of the sum of squared independent standard normal variables. Furthermore, this distribution is uniquely characterized by a parameter “k” – the degrees of freedom.

As a special case of the gamma distribution, the chi-square distribution is integral in hypothesis testing as well as in constructing confidence intervals in economics. It’s positively skewed, attaining symmetry with increasing degrees of freedom (k). Moreover, the distribution’s mean and variance are directly linked to its degrees of freedom. It finds extensive use in statistics and economics, such as chi-squared tests for fit.

Econometrics Tutorials with Certificates

Probability Density Function of the Chi-square Distribution
The Probability Density Function (PDF) for a chi-square distributed variable with “k” degrees of freedom is provided by the following equation:

Therefore, the chi-square distribution and its probability density function are determined by the parameter “k“. That is, the shape of the PDF is determined by the degrees of freedom “k“. Moreover, it is important to note that the PDF is defined for all values of X greater than 0.
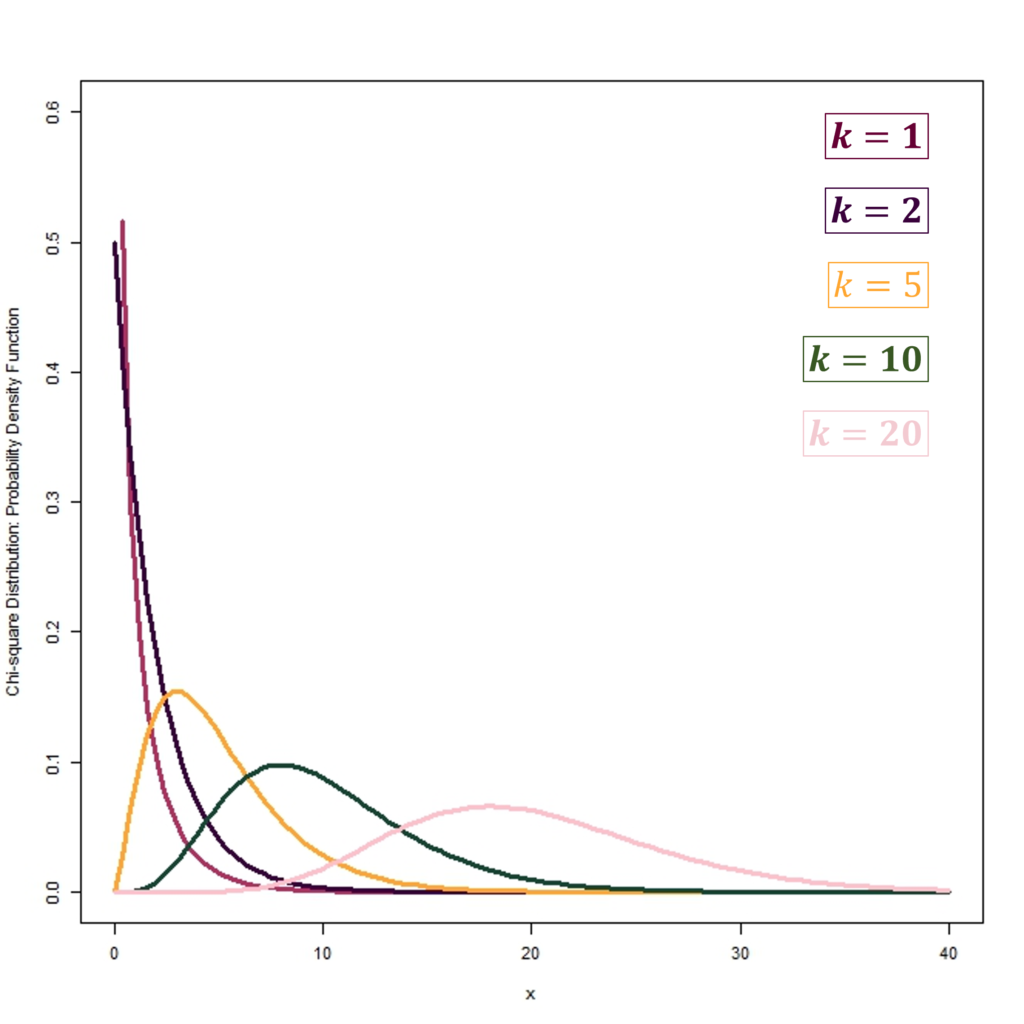
In the graph above, we can observe the PDFs of the chi-square distribution with different degrees of freedom “k“. Additionally, the PDFs are positively skewed at low degrees of freedom. With an increase in the degrees of freedom, PDFs also become a lot more symmetrical. For instance, the PDF with k = 20 is much more symmetrical as compared to the PDFs with k equal to 1, 2, 5 or 10.
Cumulative Distribution Function of the Chi-square Distribution
Furthermore, the cumulative distribution function (CDF) of the chi-square distribution sits at the core of understanding the statistical significance linked to chi-square tests. It shows the probability that a chi-square distributed random variable will fall at or below a certain value. The CDF for the chi-square distribution with k degrees of freedom is outlined as follows:

Hence, the CDF of the chi-square distribution is derived from the gamma and lower incomplete gamma functions.
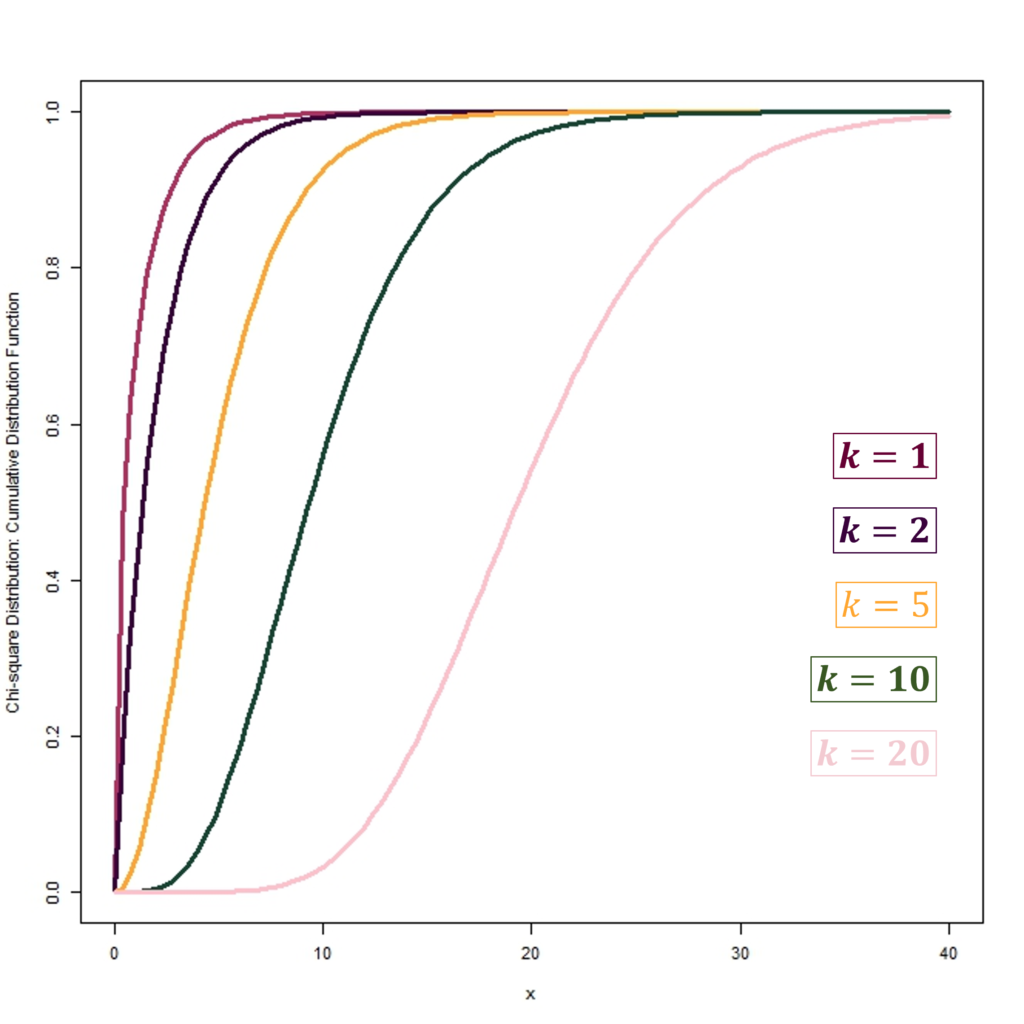
The CDFs shown in the diagram above are examples of the chi-square CDFs with different degrees of freedom “k“. These CDFs have the same degrees of freedom “k” as the PDFs shown earlier.
Application of Chi-square distribution in Economics
Survey Data Analysis
The significance of the chi-square distribution in economics cannot be overstated. This is because of its broad applicability in diverse research domains. It is also prominently employed in examining survey data, where details on categorical variables like gender, occupation, or income are gathered. Chi-square tests serve to discern significant differences in variable distributions among demographic cohorts, or the autonomy of survey responses.
The chi-square distribution proves particularly adept in parsing survey data, shedding light on interrelationships between categorical variables. Through chi-square tests, one can discern significant divergence in survey response distributions among demographics, or the independence of survey elements. This analysis offers crucial insights into population preferences, behaviours, and traits, invaluable for economic policy and decision-making.
Hypothesis Testing
Moreover, in economic hypothesis testing, the chi-square distribution assumes a critical role. Researchers employ it to evaluate if empirical data substantiates or disavows economic postulations or models. Significance is ascertained by examining the chi-square statistic against critical values, aiding in decisive hypothesis acceptance or rejection.
The chi-square distribution’s role in economic hypothesis testing is indispensable and used to validate or invalidate economic theories. Researchers evaluate data via chi-square tests, determining its support for postulated models and theories.
Conclusion
The chi-square distribution is pivotal in economic research and analysis, offering crucial insights into discrepancies between actual and anticipated data. It gauges variant influences of independent categorical variables and is indispensable for hypothesis testing and model assessment in economics.
Economists, through a deep grasp of the chi-square distribution, augment the precision and integrity of their research. The distribution represents a keystone in economics, supporting various statistical evaluations. These analyses drive pivotal decision-making and policy formulation processes.
Econometrics Tutorials with Certificates

This website contains affiliate links. When you make a purchase through these links, we may earn a commission at no additional cost to you.