The F-distribution is a continuous statistical distribution developed by Ronald Fisher and George W. Snedecor. It stands crucial in hypothesis testing and the scrutiny of variance within diverse disciplines, prominently in economics. The F-distribution arises as the ratio of independent chi-square variables, each divided by its degrees of freedom. That is, it is defined by parameters df1 and df2 which reflect the numerator and denominator degrees of freedom respectively.
This distribution’s applicability is vast, found in statistical investigations to contrast variances among disparate groups or scenarios—a fundamental element of ANOVA and regression analysis. Furthermore, it serves in judging model appropriateness in nested situations, granting researchers the capacity to enhance their analytical models.
Econometrics Tutorials with Certificates

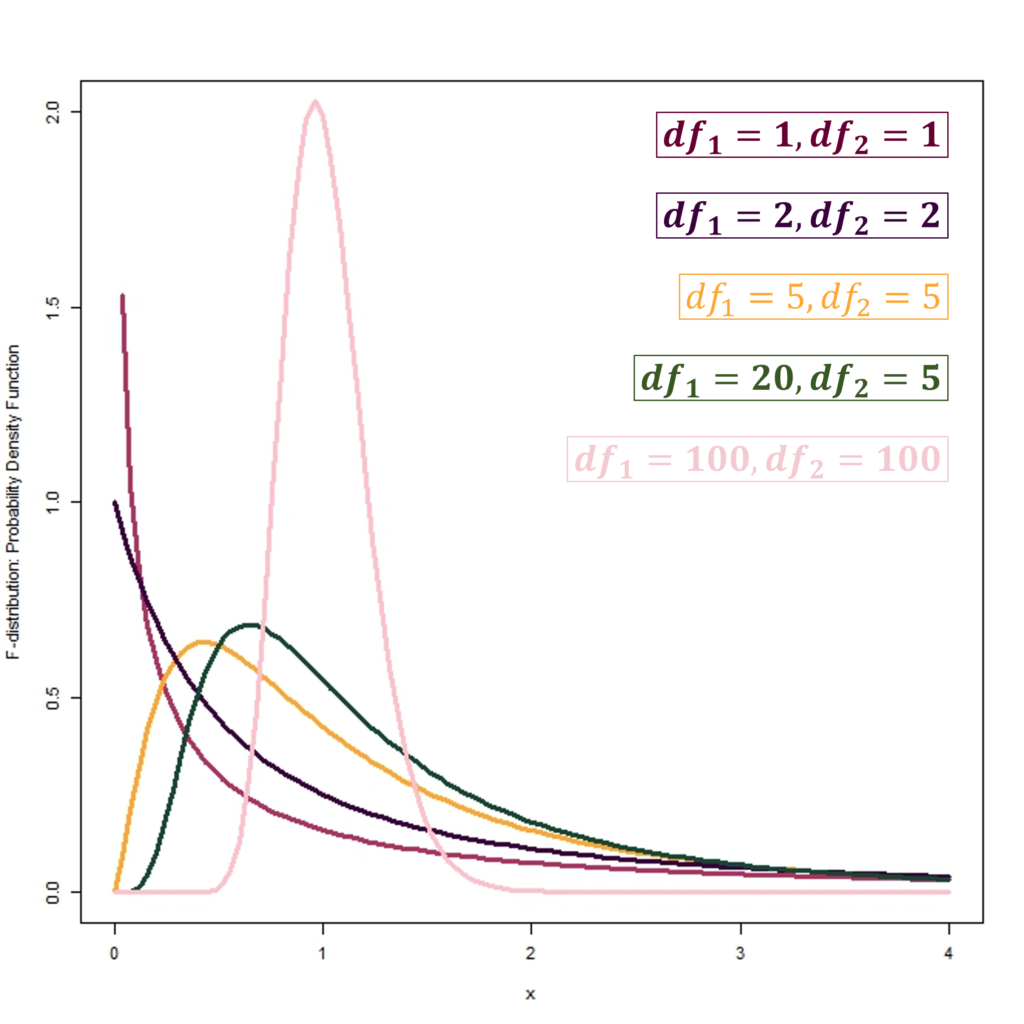
Probability Density Function of F-distribution

The significance of df1 and df2 lies in denoting the degrees of freedom for the numerator and denominator, respectively. Also, “B” stands for the beta function. Hence, this formulation enables the pivotal computation of the F-distributed random variable’s probability density, crucial for statistical tests and analyses.
The F-distribution boasts numerous properties that enhance its utility in statistical exploration. It further permits the straightforward derivation of important moments’ values, including mean, variance, skewness, and kurtosis, depending on degrees of freedom. Moreover, its relation with distributions like chi-square facilitates deeper insight into their statistical connections.
Mean and Variance

As we can observe above, the mean of F-distribution is well defined only for denominator degrees of freedom df2 greater than 2. Similarly, the variance of the F-distribution is well-defined only for degrees of freedom df2 greater than 4.
Cumulative Distribution Function of F-distribution
The CDF shows the probability of an F-distributed random variable being less than or equal to a specific value. Hence, it is critical for calculating probabilities in the F-distribution and crucial in hypothesis tests and ANOVA.
Probability Density Function (PDF)
Cumulative Distribution Function (CDF)
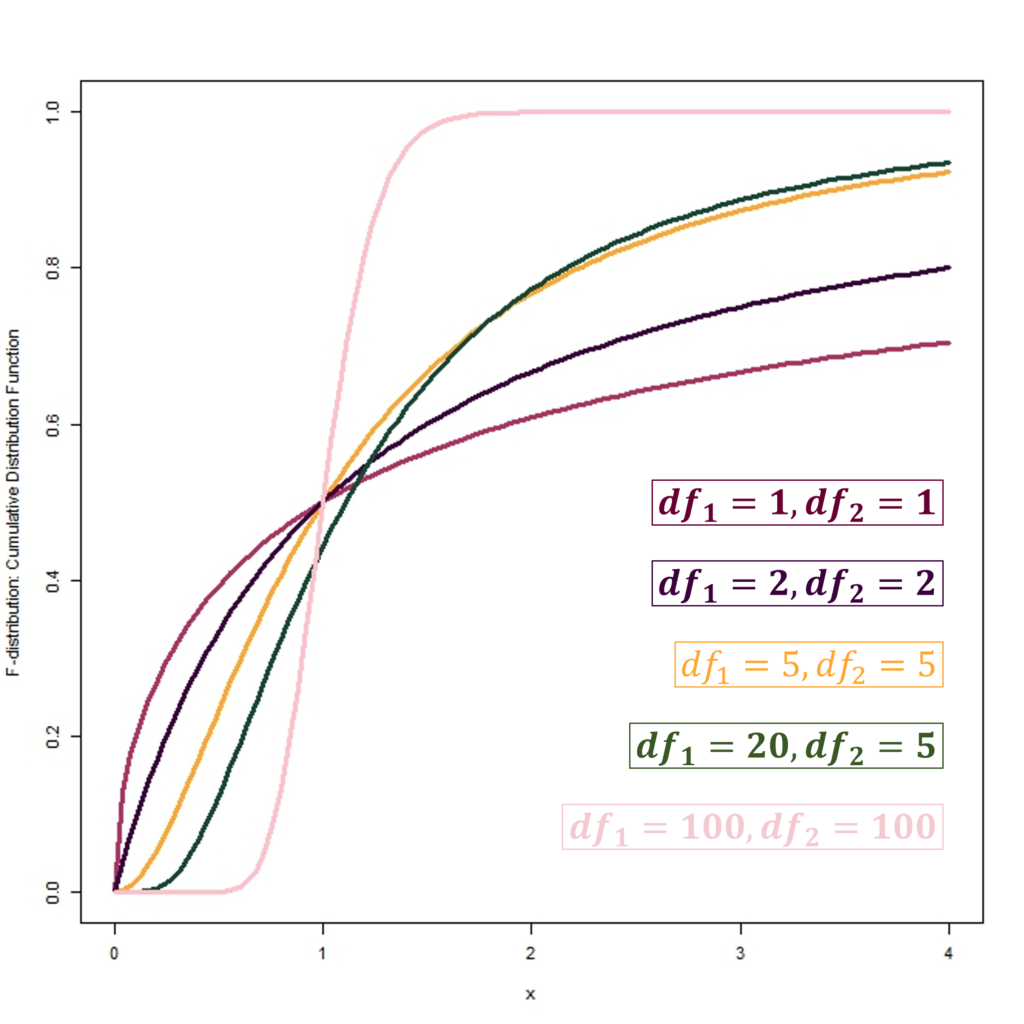
Therefore, the figures above show the Probability density functions and Cumulative distribution functions of the F-distribution with different degrees of freedom. We can also observe how the shape of the distribution changes with changes in df1 and df2. Moreover, the distribution becomes much more symmetrical with an increase in df1 and df2.
Application of F-distribution
The F-distribution also serves as a pivotal tool in statistical analysis and economics, prominently in the analysis of variance (ANOVA) and regression analyses.
Analysis of Variance (ANOVA) and Regression
The F-test within ANOVA enlightens whether the means among multiple samples starkly differ. It, therefore, quantifies the ratio of between-group variance against within-group variance and juxtaposes it with a critical F-distribution value to reach a conclusion.
In regression analysis, the F-distribution’s role is to assess the comprehensive impact of a regression model by further examining explained versus unexplained variance. It finds employment in hypothesis testing and ANOVA within economics. This distribution, right-skewed, with a bottom at 0 and no ceiling, has specific parameters for its numerator (df1) and denominator (df2).
The non-symmetric and non-negative nature of the F-distribution is ideal for scrutinizing whether different group means vary significantly. Hence, it’s essential in regression analysis, experimental design, and multiple regression models within economics.
Conclusion
The F-distribution is pivotal in statistical examination, prominently in hypothesis evaluation and analysis of variance (ANOVA). It manifests as the ratio from two distinct chi-square distributions, all controlled by their respective degrees of freedom. This design renders it ideal for the scrutiny of variances or means within a multitude of populations.
In the realm of statistical analysis and economics, the F-distribution is instrumental. It empowers researchers and analysts with the means to contrast variances and means across divergent groupings or populations. Its utility in ANOVA, regression analysis, and hypothesis testing positions it as a cornerstone in econometrics and allied disciplines.
Econometrics Tutorials with Certificates

This website contains affiliate links. When you make a purchase through these links, we may earn a commission at no additional cost to you.