The Poisson distribution is named after the 19th-century French mathematician Siméon Denis Poisson. It significantly influences the modelling of count data and the prediction of rare events in economic and financial contexts. This discrete probability distribution is frequently utilized to estimate the likelihood of varying occurrences within a specific timeframe or space. Hence, it adds significant value to business and investment strategies.
In circumstances when occurrences are rare and independent, and events commonly maintain a steady rate over a period, the Poisson distribution thrives. Therefore, it’s commonly used in modelling situations such as predicting customer orders, job applications, or product defects, amongst other instances.
Econometrics Tutorials with Certificates

What is a Poisson Distribution?
The Poisson distribution is a discrete probability distribution ideal for understanding the likelihood of a specific number of events occurring within a set timeframe or space. It further facilitates the evaluation and projection of the incidence of rare or unrelated events occurring consistently. This includes scenarios such as the volume of car crashes on select roads or the foot traffic timing at banking venues over a given hour. The most important characteristics of Poisson distribution are:
- The distinctive feature of the Poisson distribution is its singular parameter, lambda (λ), denoting the anticipated or average number of events within a defined interval. It is assumed to be constant and independent of any occurrences or events.
- The Poisson process, the foundation of the Poisson distribution, assumes events as independent. That is, the occurrence of one event does not affect the probability that other events will occur.
- It serves to compute the likelihood of a specific number of events/occurrences within a given temporal or spatial interval.
- Events do not occur simultaneously.
- Widely employed within economic and financial modelling as well as various other disciplines for count data and infrequent event analysis.
Hence, these characteristics and assumptions of the Poisson distribution render it ideal for scenarios like customer influx at retail sites or insurance claims filed, where events unfold independently.
Probability Mass Function of Poisson Distribution
The Poisson distribution delineates the probability of an exact number of occurrences within a specified interval, assuming a constant known mean rate or λ. Moreover, the probability mass function governing such events is:

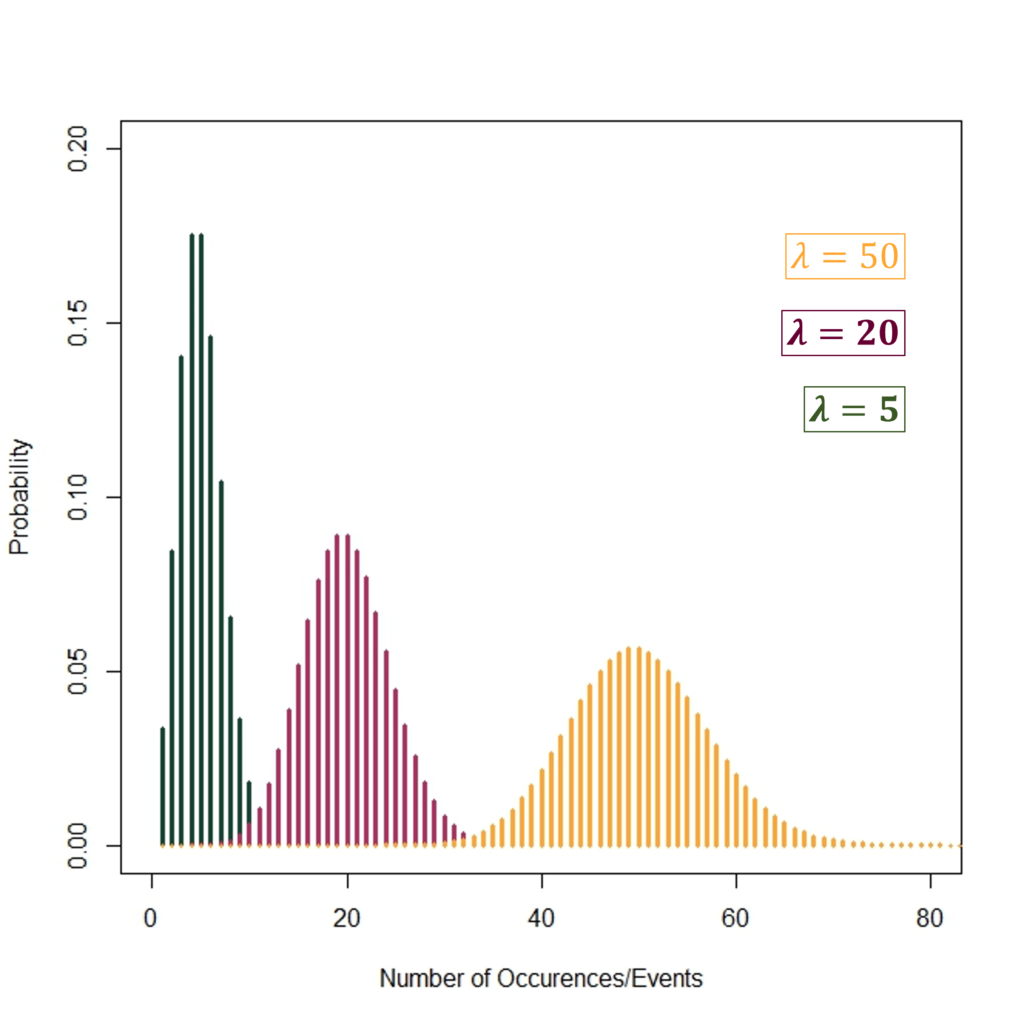
The graph above depicts the Probability Mass Functions of the Poisson Distribution with different values of the parameter λ. When the mean number of events or λ = 5, the Probability Mass Function has relatively steeper probabilities shown by the histogram on the left (in dark green). As λ increases further to 20 and 50, the probabilities of the number of events become relatively flatter.
Also, the mean and variance of the Poisson Distribution are equal to each other. Moreover, the mean and variance are determined by the average number of events/occurrences, that is, λ.

Cumulative Distribution Function of Poisson Distribution
The cumulative distribution function (CDF) allows us to gauge the probability of witnessing up to a certain number of events. Its definition also aligns with the probability that a random variable X equals or falls below a specified non-negative integer k.
The Poisson CDF exhibits a step-like pattern at integer values of k because it is a discrete distribution. It remains constant in between integer segments due to the nature of dealing solely with whole event counts.
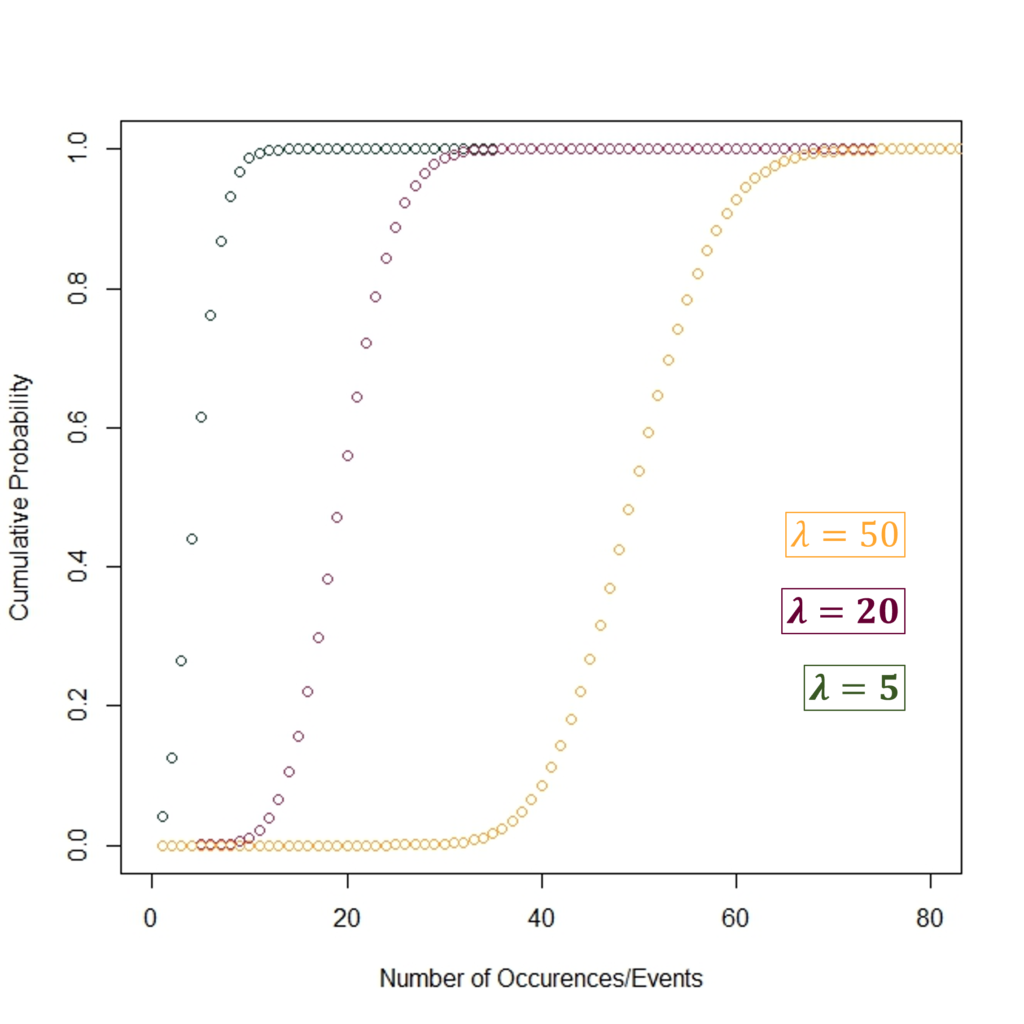
The graph shows the Cumulative Distribution Functions of the Poisson Distribution at λ = 5, λ = 20 and λ = 50. At lower values of λ, the cumulative probability approaches 1 quickly at a smaller number of events because the mean number of events is low. Similarly, at higher λ values, the cumulative probability approaches 1 relatively slowly as observed for λ = 20 and then λ = 50.
Examples of Poisson Distribution
The Poisson distribution’s utility extends across numerous domains. Furthermore, it’s apt for modelling diverse phenomena, from meteorite impacts on Earth to student exam results. Such examples further underscore its widespread relevance, spanning applications in astronomy, materials science, economics, and beyond. This positions it as an indispensable analytical asset.
In practical business settings, the Poisson distribution is a go-to. Take the example of a fast-food drive-through, seeing an average of 3 visitors per minute. By using the Poisson distribution, one can forecast events, be it a customer-free moment or a surge surpassing 5 individuals. Such insights inform strategic decisions, aiding in optimal staff arrangements. Its reach extends to mutation detection, financial modelling, and emergency preparedness.
| Assumption | Example 1: Restaurant Arrivals | Example 2: Network Failures |
| The number of events can be counted | The restaurant customer count is an observable event (e.g., 200 customers). | Network failures are quantifiable (e.g., 3 failures). |
| Independence of events | One customer’s arrival doesn’t tie to another customer’s arrival. | A network failure doesn’t impact the odds of another occurrence. |
| Constant average rate | A consistent rate of customer arrivals is computable and unchanging. | Network failure rates can be calculated and remain stable. |
| No simultaneous events | At any given moment, the restaurant’s customers do not arrive simultaneously. | Network failures occur independently in time. |
Count Data Modelling
| Uses | Description |
| Poisson distribution in finance | Ranging from an investor’s trade count in a day to the market shock occurrences over a period, the Poisson distribution is tailor-made for modeling these independent events. It is quintessential for economic and financial analyses. |
| Poisson distribution statistical modeling | At the forefront of statistical modeling lie Poisson regression models. These models, by leveraging the Poisson distribution, dissect the links between predictor variables and the anticipated event counts. |
Conclusion
The Poisson distribution plays an integral role in statistical analysis, particularly in economic and financial contexts. It offers a method to predict the likelihood of a set number of events happening within a defined interval. This ability helps decision-makers optimize strategies, enhance operational processes, and mitigate risks associated with discrete variables. Its applicability spans from rare event prediction to the analysis of financial transactions, underlining its significance within the statistical repertoire for researchers and industry professionals.
In summary, the Poisson distribution is a cornerstone in economic and financial analytics. Its inherent flexibility and mathematical elegance are critical for professionals seeking to glean insights from count data. Ultimately, its use leads to more sophisticated decision-making processes and streamlined operations.
Econometrics Tutorials with Certificates

This website contains affiliate links. When you make a purchase through these links, we may earn a commission at no additional cost to you.