The t-distribution, an essential tool also known as the Student’s t-distribution, resembles the normal distribution but it is tailored for scenarios where sample sizes are small and population variance is uncertain. This variant is pivotal for economic research, as it accommodates the frequent inadequacy of sample size and clarity regarding population variance.
The t-distribution plays a pivotal role in econometric and statistical methods. That is, it underpins techniques including hypothesis testing, confidence interval estimation, regression analysis, and Bayesian inference. Its adaptability and efficacy render it an indispensable instrument for economists dealing with the uncertainties of empirical data and the intricacies of economic dynamics. Here, we will scrutinize the t-distribution’s underlying principles and features.
Econometrics Tutorials with Certificates

What Is The t-Distribution?
The t-distribution, also known as the Student’s t-distribution, is a continuous probability distribution. It mirrors the normal distribution but has heavier tails. These “tails” further indicate a higher likelihood of generating exceptional values. Its shape, a symmetrical curve, is prevalent in statistics, notably for small samples and unspecified population variances.
Its conceptualization is credited to William Gosset, a Guinness Brewery statistician. He disseminated his work under the pseudonym “Student”. Gosset’s creation enabled statistical insight with small sample sizes. Crucially, it also remains effective even in the absence of a population variance figure.
Therefore, akin to the normal distribution, the t-distribution is a continuous model with a bell shape. Yet, what sets it apart are its heavier tails. As a result, this leads to increased probabilities of encountering extreme values. Furthermore, the t-distribution thrives where sample sizes are diminutive and population variance eludes detection.
Probability Density Function Of t-Distribution

The degrees of freedom (α) stand as a critical parameter, intrinsically tied to sample size. Generally, for the t-distribution, α is the sample size less one (α = n – 1). A higher α affords the t-distribution to exhibit a reduction in tail thickness, known colloquially as becoming more ‘spiked’.
This pivotal role of degrees of freedom (α) extends to defining the t-distribution’s shape. A decrease in α gives the distribution heavier tails. Conversely, elevation in α aligns the t-distribution closer to a standard normal distribution.
Symmetry, Bell Shape, and Tail Behavior
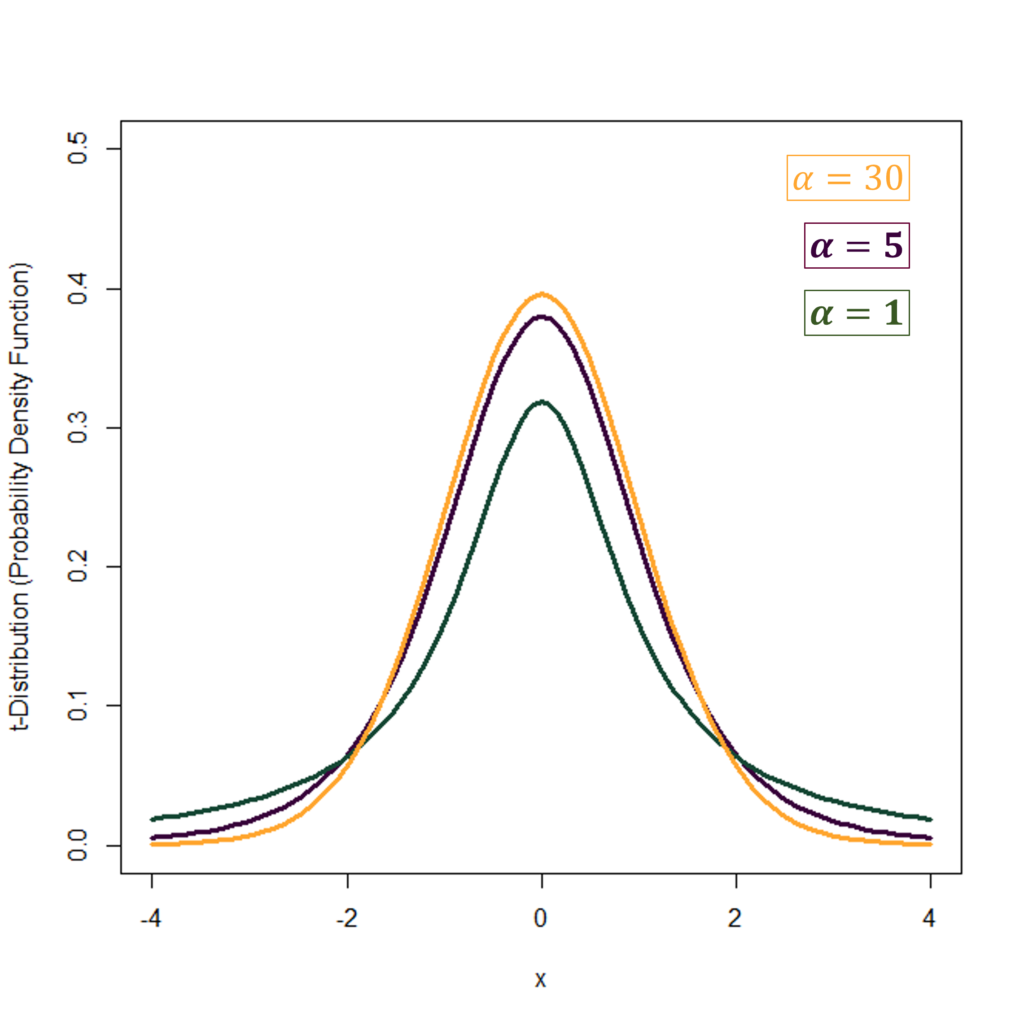
The t-distribution reflects symmetry at a mean of zero, akin to the standard normal distribution. This indicates an equal chance of producing values above or below the mean. We can observe the symmetrical shape in the Probability Density Functions shown in the first diagram. With degrees of freedom α = 1, the distribution has heavier tails and a lower peak. As α increases to 5 and then to 30, the tails become thinner and the peak becomes higher. As the degrees of freedom (α) grow, the bell shape of the t-distribution also becomes increasingly similar to the standard normal distribution.
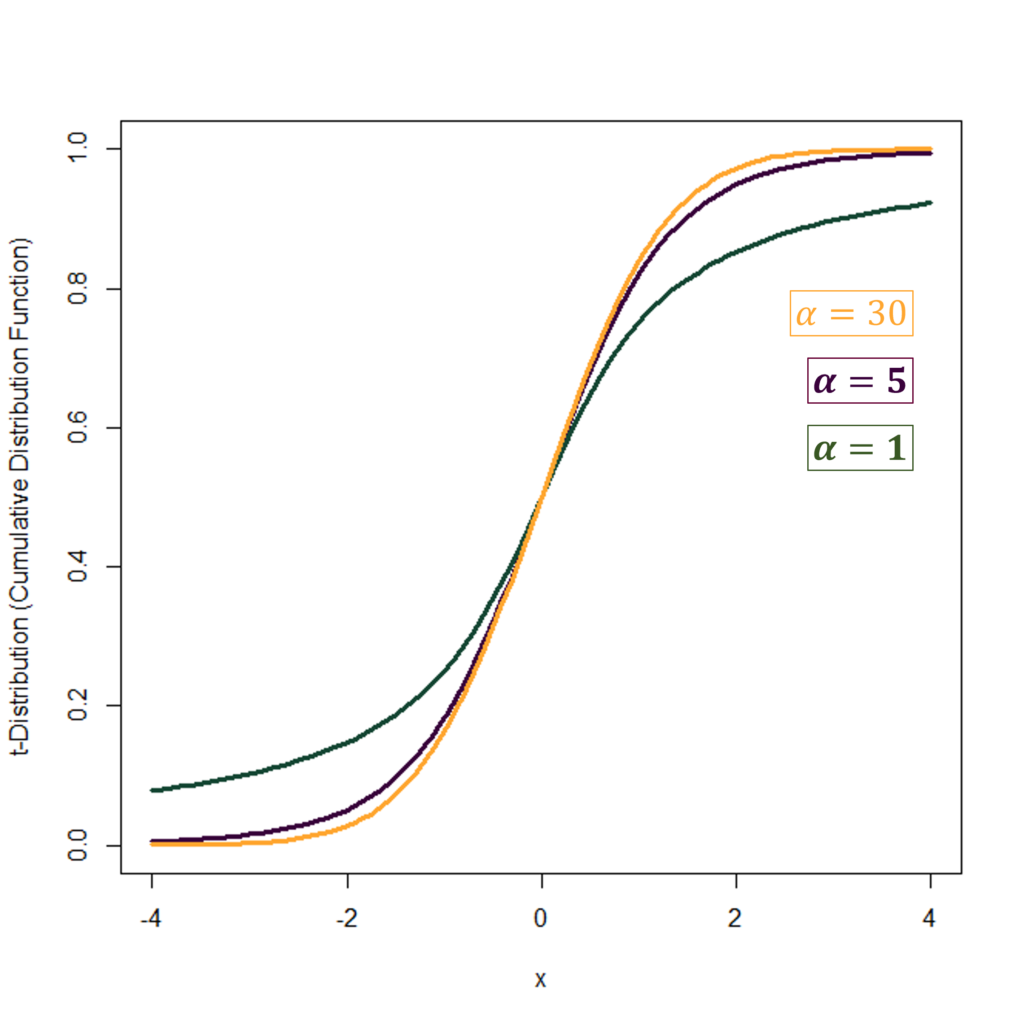
We can observe the same in the Cumulative Distribution Functions with different degrees of freedom in the second diagram. The distribution with α = 1 has thicker tails, whereas, the tails become thinner as α increases to 5 and then to 30.
t-Distribution vs Normal Distribution
The t-distribution, while sharing similarities with the normal distribution, reveals distinctive features. Notably, it possesses heavier tails, implying an increased probability for values farther from the mean. This characteristic is captured by the kurtosis, with the t-distribution exhibiting greater kurtosis than the normal distribution.
- The t-distribution is pivotal in areas like economics for hypothesis testing, confidence interval construction and regression analysis with small samples.
- Applying the t-critical value is essential for sample sizes 30 or less when creating confidence intervals. Conversely, for larger sample sizes, selecting between t and z-critical values becomes inconsequential.
- Noteworthy is how the t-distribution’s shape evolves with degrees of freedom (α), mirroring the normal distribution more closely with increasing degrees of freedom (α).
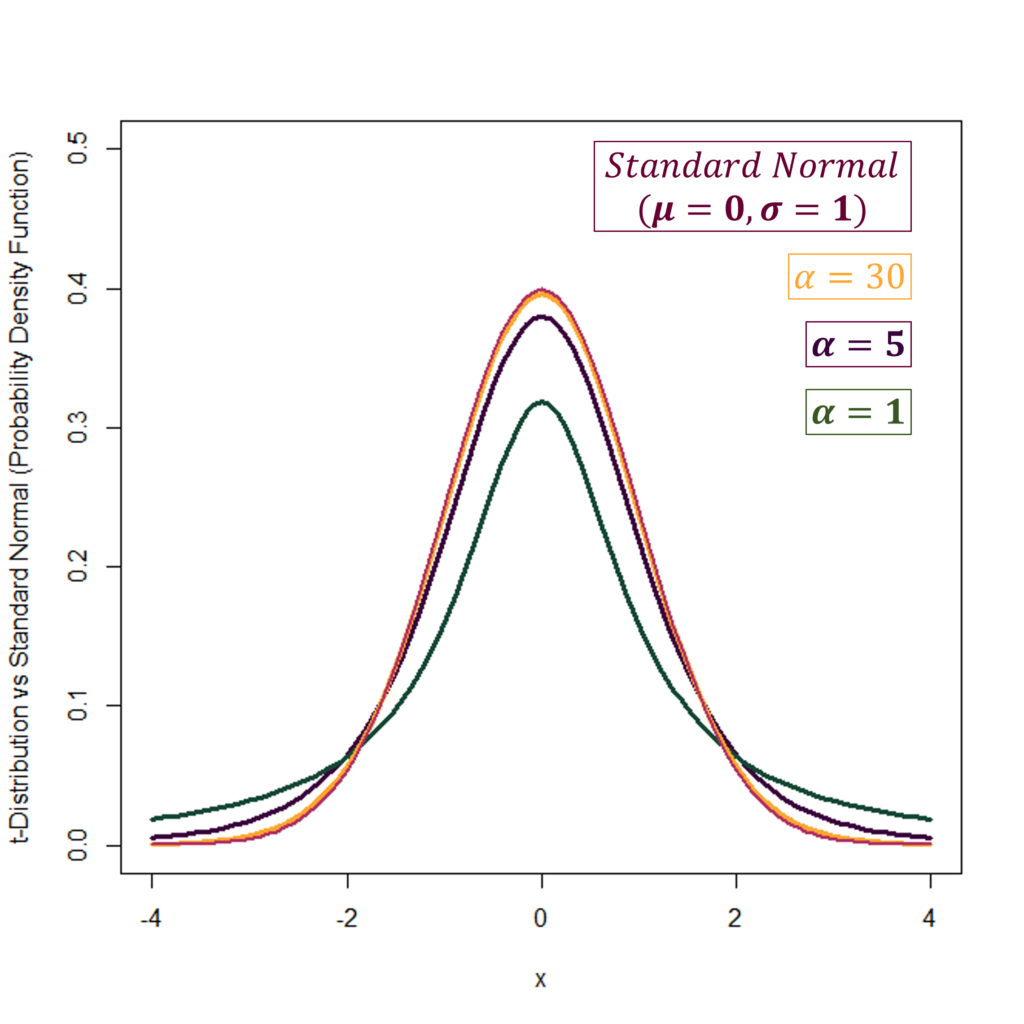
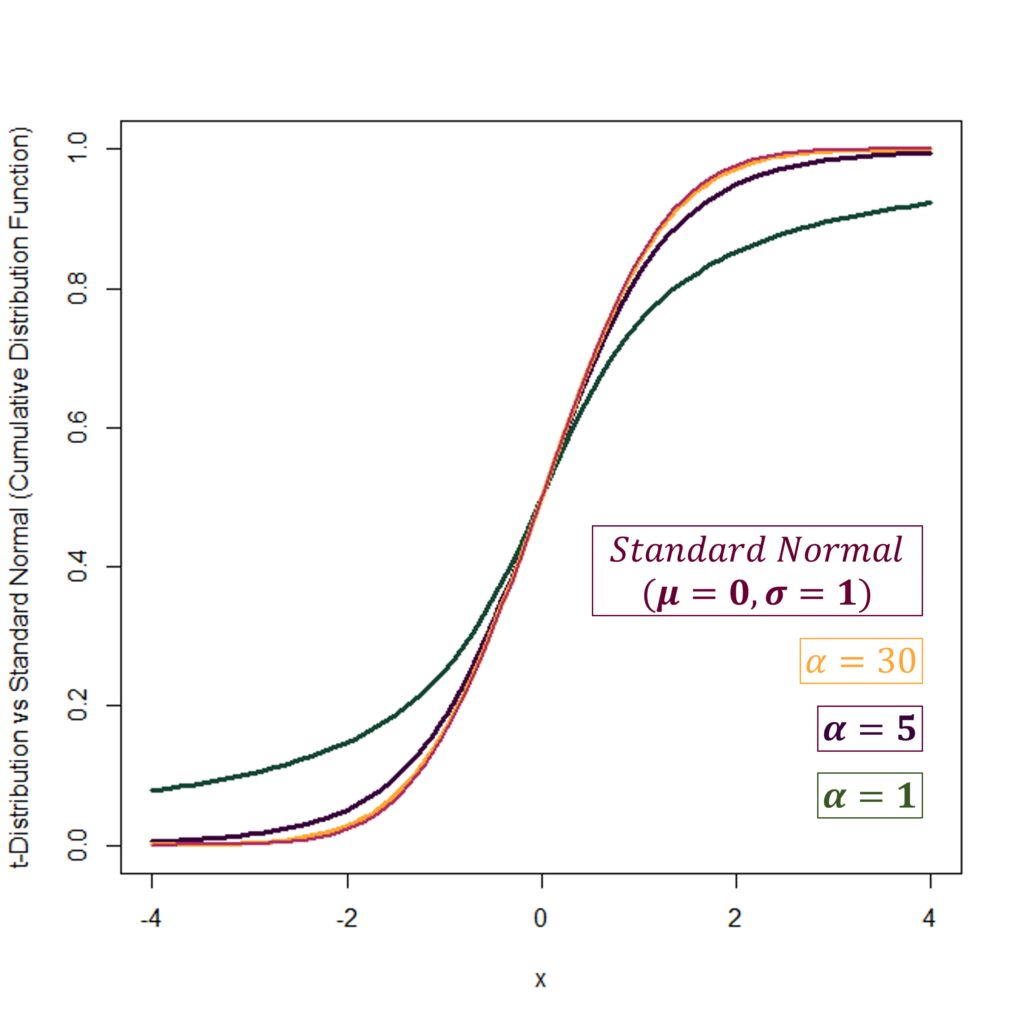
In the diagrams above, we can also observe the behaviour of t-distribution as compared to a Standard Normal distribution with mean 0 and variance 1. As the degrees of freedom (α) increase in t, it keeps getting closer and closer to a standard normal distribution. The Standard Normal distribution is shown in “maroon” in the diagrams and is the PDF with the highest peak. At α = 1 (PDF in green), the t-distribution has a much lower peak and heavier tails than the standard normal. However, as α increases to 30, the t-distribution is almost the same as the Standard Normal.
| Comparison | t-Distribution | Normal Distribution |
| Sample Size | Small | Large |
| Population Variance | Unknown | Known |
| Symmetry | Symmetric | Symmetric |
| Tail Behavior | Heavier tails | Lighter tails |
Use Of t-Distribution In Economics
| Application | Description |
| Hypothesis Testing | Determining the significance of the difference between a sample mean and a hypothesized population mean, or the difference between two sample means. |
| Confidence Intervals | Constructing intervals that are likely to contain the true population parameter based on sample data. |
| Regression Analysis | Making inferences about the relationships between independent and dependent variables. |
Econometrics and Finance
The t-distribution is also a cornerstone of statistical analysis in economics and finance. As a result, it is applied in several key sub-fields of economics. These include risk analysis in stock markets, managing international portfolio risks, determining the prices of financial derivatives, and studying insurance loss data and stock returns. What makes it further valuable is its ability to adjust to various degrees of freedom, making it a versatile and preferred selection for data analysis in economics and finance.
It also plays a critical role in econometric modelling. Thus, it is indispensable in hypothesis testing and establishing confidence intervals for model parameters. Especially, its performance in situations with small sample sizes or when the population variance remains unknown is noteworthy. Here, the t-distribution delivers a far more precise representation of the distribution, further facilitating more dependable statistical inferences.
Use in T-tests, Confidence Intervals and Statistical Inference
The t-distribution also serves as a cornerstone for numerous t-tests within statistical inference. It further allows analysts to draw conclusions regarding population means from sample datasets. Especially when the population’s standard deviation is not provided and sample sizes are diminutive, this distribution emerges as pivotal.
T-tests, an integral part of statistics, determine if there exists a significant discrepancy between the means of two independent groups assuming their variability is unknown. In analyzing larger datasets, however, statisticians may turn to alternative methods, like z-tests, chi-square tests, and f-tests, suited for differing scenarios.
For analyzing dependent or repeated measures, the paired sample t-test is ideal. Whereas, the equal variance t-test is preferable when sample groups display uniform variability. For situations wherein the samples differ significantly in size and variance, Welch’s t-test is often used.
Conclusion
The t-distribution holds pivotal roles across disciplines such as economics. Its unique capacity to accommodate scant sample sizes and the absence of population variance information renders it indispensable for data-driven investigations. Proficiency in t-distribution further equips statisticians and econometricians with a deeper analytical acumen.
This distribution lays a sophisticated groundwork for drawing population parameter inferences, particularly under restricted samples. Integral to hypothesis testing, confidence interval delineation, and related economic inquiries, its precise probabilistic model underpins critical analytical methodologies.
Within the ever-evolving realm of economics, the t-distribution also remains an enduring tool in the arsenal of statisticians and economists. Command over it sharpens the aptitude of researchers, further propelling the extraction of pivotal insights from data. In turn, this facilitates enhanced strategic and policy decisions. The adaptability and reliability of this distribution cement it as a cornerstone in contemporary economic analysis.
Econometrics Tutorials with Certificates

This website contains affiliate links. When you make a purchase through these links, we may earn a commission at no additional cost to you.